Tablets and smartphones are now standard equipment on many pleasure craft. No wonder, as they are versatile and often replace or supplement traditional navigation systems.
In the maritime sector, the discussion about the usefulness and quality of these services has been going on for a long time. But what is the situation on inland waterways? Our test should help you decide.
If you search for navigation apps in the Apple App Store or the Google Play Store, you will quickly and extensively find what you are looking for. However, a closer look reveals fundamental differences, especially with regard to inland waterways. Many of the providers do not offer any charts for inland waterways.
Some limit themselves to just a few sections and leave ambitious inland skippers in the dark if they want to navigate outside this area.Plan2Nav for example, currently only has maps of France on offer. Others likeSeapilot are limited to a few bodies of water such as the Schlei, the Elbe as far as Hamburg or the Weser as far as Bremen.

We have limited our analysis to those providers that offer a reasonably comprehensive range of services. These are the offerings ofCard yard from Flensburg, theNV publishing house from Eckernförde, whoiSailor app by Transas from Ireland,SeaPal - a joint development of the University of Applied Sciences Konstanz and the Internationale Bodensee Nachrichten IBN and theNavionics-App from Italy. TheYacht Navigator App from Delius Klasing Verlag will be tested in a later edition, as the corresponding inland maps will not be available until later this year.
Data basis
The different availability of maps is also due to the fact that the providers have approached the task very differently. The easiest way is to use so-called ENC data sets. ENC stands for "Electronic Navigational Charts". The officially produced data in S-57 format is produced by the Federal Maritime and Hydrographic Agency (BSH) and is available for the German Baltic and North Seas.
Corresponding data sets are available from the Federal Waterways and Shipping Administration (WSV) for inland waterways. However, only the main arteries of commercial shipping are shown. And this applies not only to the selectable areas - the Elbe-Lübeck Canal or the Ems, for example, are not available - but also to the visualisation of the individual route sections.
Due to the provision for commercial shipping, only the fairway is described in detail. All adjacent waters are only rudimentarily illuminated or not at all. This means that the water depth in a bay away from the fairway often remains a mystery to the skipper. It is therefore also crucial to what extent the providers edit the data sets provided or possibly produce them themselves according to the official map sets.
Form of presentation
The formerly important distinction between raster and vector maps has now lost some of its significance, at least in the inland area. Raster maps are comparable to a scanned classic paper map. They consist of a single two-dimensional layer and only contain the information printed on it, no matter how much you zoom in or out. They also become somewhat pixelated when zoomed in, and "close up" when zoomed out, making them somewhat confusing due to the constant density of information.
Vector maps therefore offer the fundamental advantage that the resolution always remains sharp when zooming in and out and the display therefore does not become pixelated. Vector maps have been created specifically for the digital world. Here, the individual pieces of information lie on several levels. Depending on the zoom level, certain details can be shown or hidden and the display always remains clear and sharp. However, this is also a danger of the vector map. As only part of the information is available depending on the zoom level, necessary details may be missing because you are currently at the wrong scale.

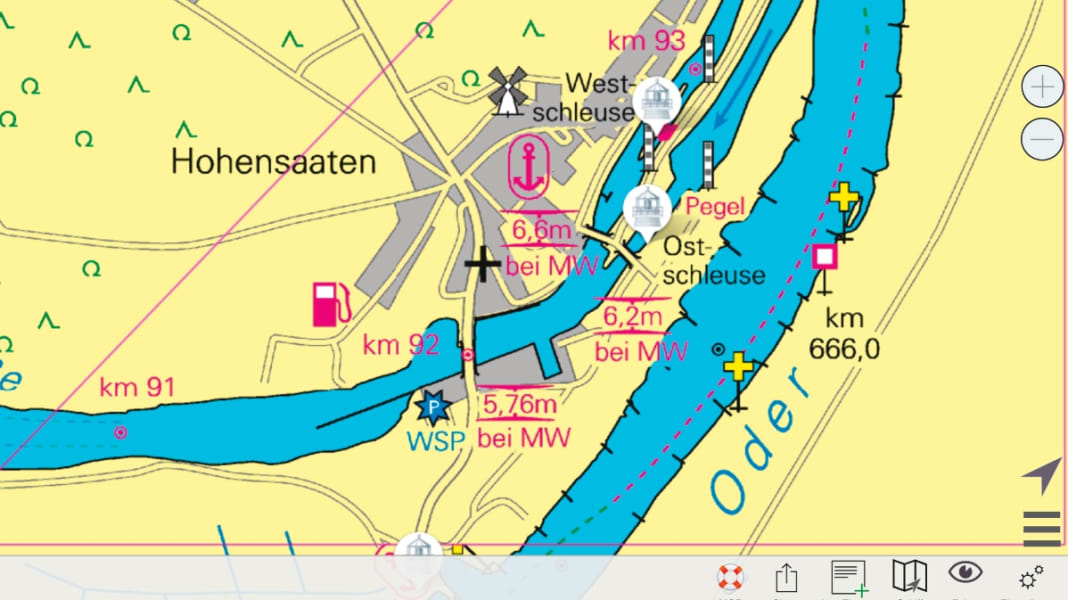
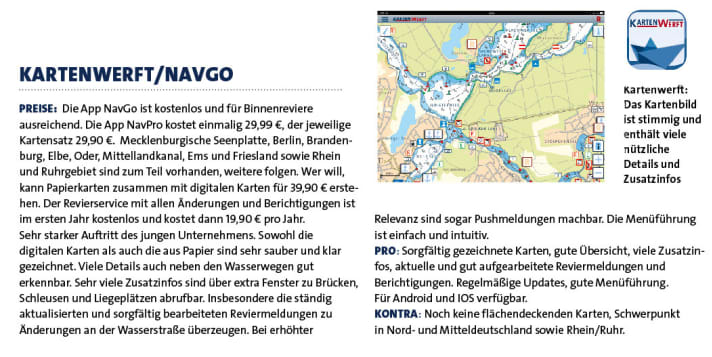
Kartenwerft from Flensburg and NV-Verlag from Eckernförde try to combine the best of both worlds. Here, various raster maps of different scales are superimposed on one another, and you can see from a small square on the map that there is a second map, for example of a harbour facility, which can be called up with a click. In this way, three to four maps are sometimes "stacked" on top of each other and allow you to view different scales. What's more, certain additional information can be displayed using vector visualisation. This combines vector and raster display in one map.
Additional information
This brings us to a very important point. The additional information is a criterion that determines the quality of inland software more than at sea. The requirements for navigation software are different here. It is essentially not about determining a location and setting a course.

The location is relatively easy to determine from the map and the course is determined by the fairway or the course of the water. Wind and current play a subordinate role in the intended and actual course. You orientate yourself by the course of the buoys or the shoreline.
Here, however, other information becomes much more important than is the case at sea. The exact depth contours, for example, are essential for every inland skipper. The bridge height must be indicated and correct. The opening hours of the lock and the radio channel or telephone number of the lock keeper often save waiting times or detours.
Updating and updates
And this is the next important point when evaluating software for navigating inland waters. The question of updating the information and updating the data records. By update, we mean updating the entire data set to the latest possible date. This means that all new information for the relevant section of the route must be incorporated into the chart so that the skipper can be sure that the latest information is displayed on his device.
The information density per distance travelled is many times higher in inland waters than at sea. One reason for this is the density of information. Every few metres there is a buoy, a bridge, a speed limit or a ban on anchoring. In addition, there are external influences, as the route meanders through utilised and populated land.

Construction work on buildings, bridges, power lines and supply lines often also affect the rules of behaviour on the respective waters. This means that between updates, it must be ensured that all this information reaches the skipper quickly and reliably. Ultimately, the decisive factor is how quickly and in what form the messages and notices to mariners (NfS, BfS) and the information from the Electronic Waterway Information Service (ELWIS) are incorporated into the respective offers.
From our point of view, Kartenwerft has achieved this in an exemplary manner. All incoming messages and corrections are processed there and converted from technical German into a more comprehensible language format and then made available to the customer immediately. Often only a few hours pass between publication by the WSV and the skipper being informed. They are then incorporated into the next chart update.
Peripherals
For anyone planning to travel on the Rhine or other busy waterways, the integration of AIS data from an on-board AIS transmitter and receiver (Internet data is too unreliable here) and a radar device could also be useful. An NMEA interface for smooth data exchange forms the basis for future extensions.

Summary
You can tell from the apps that mobile navigation for inland waterways has only recently been discovered by providers as a lucrative business segment. Either there is a lack of nationwide coverage or too little attention is paid to the special features of navigation in inland areas. If you are planning a cruise in northern and central Germany or on the Rhine, our first choice would be the Flensburg-based Kartenwerft.
They offer very good charts and a very up-to-date and reliable update of all changes along the route. nv charts also shows strengths in the areas offered, but is somewhat weaker when it comes to updating. If you have more plans and want to cover larger areas without having to change providers, Navionics is definitely worth considering.

