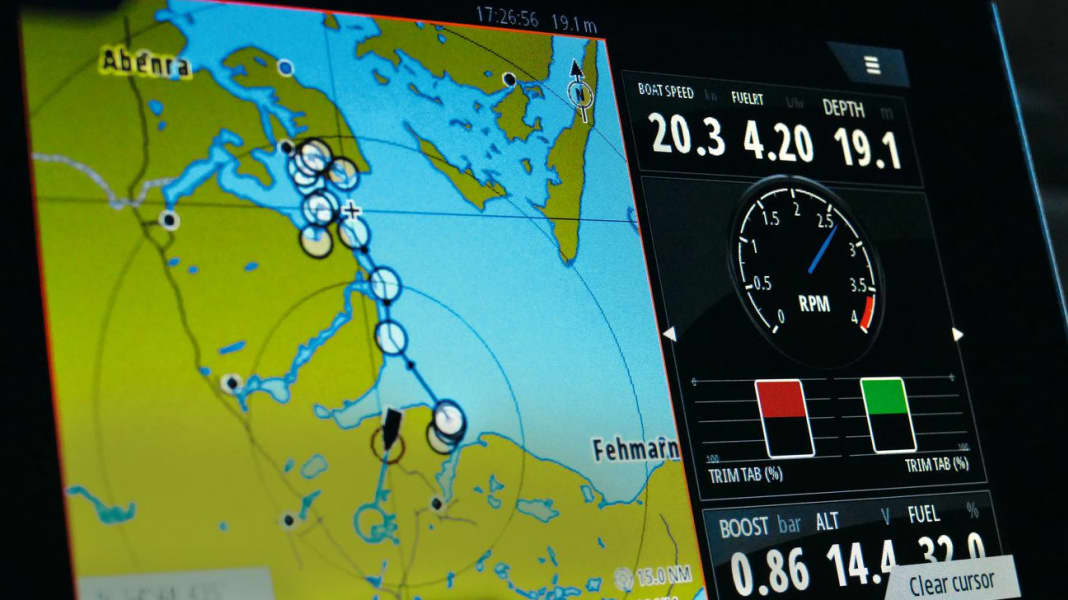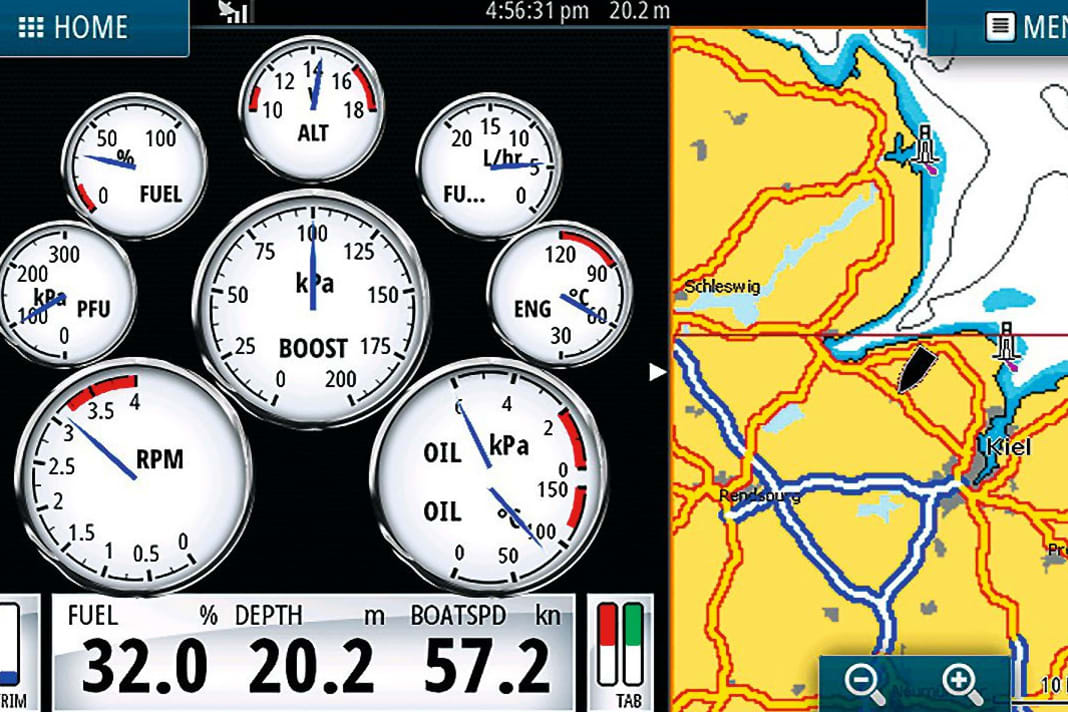
Many skippers would like additional displays for more detailed information on the engine or trim.
Or even a complete second set of instruments for the flybridge. With conventional electrics, such projects involve complex wiring and require the courage to saw holes in the beautiful dashboard.
A little-known alternative to this is the display on the screen:
Many chart plotters already on board can do this; it is not for nothing that manufacturers now refer to these devices as multifunction displays.


The data from the engine, tank sensors and trim tabs are fed into the NMEA 2000 network and can then be called up on as many devices as you like.
You can find out whether your chart plotter is able to do this by taking a look at the selection of screen pages to be displayed. The typical dashboard view is easy to recognise there. You then only need the interface between the engine and the network.
Replacing the electronic chart completely with the instrument display would of course be pointless. However, all modern multifunction displays offer the option of putting together your own display combinations, usually in several variants. In the example on the right, we have selected full instrumentation and a small map for the route at the top. The lower combination shows more map for route planning and only the most important engine values in numerical form.
CONCEPTS
The type of interface you need depends on the principle on which the electrics of your drive system are based. In general, there are two different groups: In a conventional system, a separate cable is laid for each signal to connect sensors, encoders, displays and indicator lamps.
On the one hand, this makes it easier to carry out work yourself, as the individual circuits can be checked with a simple multimeter. On the other hand, on machines with many measuring points, the wiring harness quickly becomes very extensive and therefore confusing.
In addition, the values have to be measured individually at many points during diagnostics. Instead, digitalised drives use a data bus to connect all control units on the machine and the displays on the control stand.
In principle, this means that only four wires go from the engine to the dashboard: two for the power supply and two on which the measured values and control signals are transmitted as digital data records.
In fact, not everything is digital, because it would still be too expensive to give each individual temperature sensor or oil pressure switch its own microprocessor for communication on the data bus. It is common for several of these simple sensors to be connected individually to a nearby interface or control unit, where their values are converted to the bus.
The biggest advantage of digitalisation is that all data can be retrieved via a single connection on the motor, both for diagnostics and for normal monitoring during operation.
In addition to manufacturer-specific solutions, there are two standardised interfaces for digitalised boat engines. The electrical capabilities of your drive can be found in the documentation for your engine.
The older standard is called J1708 and provides a fairly limited portfolio of motor values. Above all, this connection is relatively slow by today's standards; the development dates back to the 1980s. J1708 itself is only a standard for the electrical connection. This is why J1587 is often specified as an additional standard for the data content.
The current standard is J1939. This standard specifies both the electrical transmission on a so-called CAN bus and the formats in which the data from the powertrain is packaged. Electrically, J1939 would be compatible with NMEA2000 - but there are very good reasons not to connect the machine's data bus and the instrument system directly to each other. This is why the data content is coded differently.
GOODS SEPARATION
The data bus of larger digitally controlled motors is usually also used to transfer operationally important values between different control units. It is therefore essential to prevent this bus from being blocked by a fault outside the drive system. However, even if the bus is functioning properly, the additional data from the instrument system could hinder fast communication within the machine - and vice versa.
One thing you certainly don't want is for the engine to die when receiving several AIS data sets, for example. This is why an interface or gateway is always used between the drive data bus and the instrument system. This only listens on the engine side, i.e. it can neither send data to it nor block this bus. The read values are then available on the NMEA 2000 side for instruments and multifunction displays.
Such interfaces are available, for example, from Actisense, Maretron, VDO and Yacht-Devices. Prices range between 200 and 700 euros. Despite standardisation, it is advisable to make sure that the interface explicitly supports your motor - among other things because of the suitably assembled connectors.
UPDATE
It is perfectly possible to subsequently digitise purely analogue machines for monitoring purposes. For this purpose, there are interface boxes that pick up the signals from existing analogue encoders or switches and make them available directly in NMEA 2000 format. With this solution, it is also not possible for there to be any feedback to the motor electrics that could jeopardise operation.
The first question to be asked in such a conversion or upgrade is whether the old instruments should remain on board or whether the entire display technology should be replaced. This depends on what the interface to be procured must be able to do.
Most sensors for pressure, temperature or fill level consist electrically of a variable resistor with two connections: One is permanently connected to earth via the sensor housing and motor block, the other is the cable to the display. The latter applies voltage to this cable; how much current then flows depends on the current value of the resistor and therefore on the measured value. The pointer position reflects this current; with the scale matching the sensor, this circuit becomes a pressure gauge, thermometer or fuel gauge.
The whole thing is electrically simple. But: There can only be one display for each sensor. If you were to attach a second instrument of the same type, the current would be split between the two displays and both would display incorrectly.
If the previous displays remain on board, the interface to the bus may only passively measure the value on the line and not feed anything in. However, if the instruments are to be completely replaced by digitalisation, the interface must also supply the sensor with voltage, otherwise no measured value will be obtained.
CONFIGURATION FREESTYLE
For motors with a bus connection ex works, you are in the clear, as you will receive pre-calibrated data. Retrofit interfaces, on the other hand, must be set to the analogue sensors yourself. In the best case scenario, you will find a type designation in the documentation for your machine, on the sensors themselves or on the associated display instrument. Then you can find out the electrical values for the calibration using Google if necessary.
Otherwise, take the experimental route: If the previous instrument is retained, then change the calibration in the interface until the bus values match the old display in normal operating mode and when the machine is cold. This works for temperatures and pressures.
Without the old display, only temperature sensors can be calibrated with on-board means: connect the removed sensor provisionally (signal and ground) and hold its measuring end in boiling water. This is sufficiently accurate to 100 degrees Celsius.
A perfect adjustment over the entire measuring range between instrument and digital display is hardly feasible, but also not necessary: Whether the cooling water thermometer displays the 40 degrees as 30 or 50 is not so important, both are too cold.
The range must be correct in normal operation; you can recognise when the machine is hot and whether there is an abnormal increase. You will know whether this is at 80, 85 or 90 degrees from the previous thermometer.
Once the values are in the NMEA 2000 bus, all connected displays can in principle access them without further calibration. However, you must set the alarm thresholds and display ranges for the graphical display on each plotter screen yourself.
The previous display instruments provide clues. For measured values that have not yet had an instrument, there should be information in the engine documentation. Otherwise, take the experimental route again: see in which range the values lie in normal operation and set the display limits a little further.

