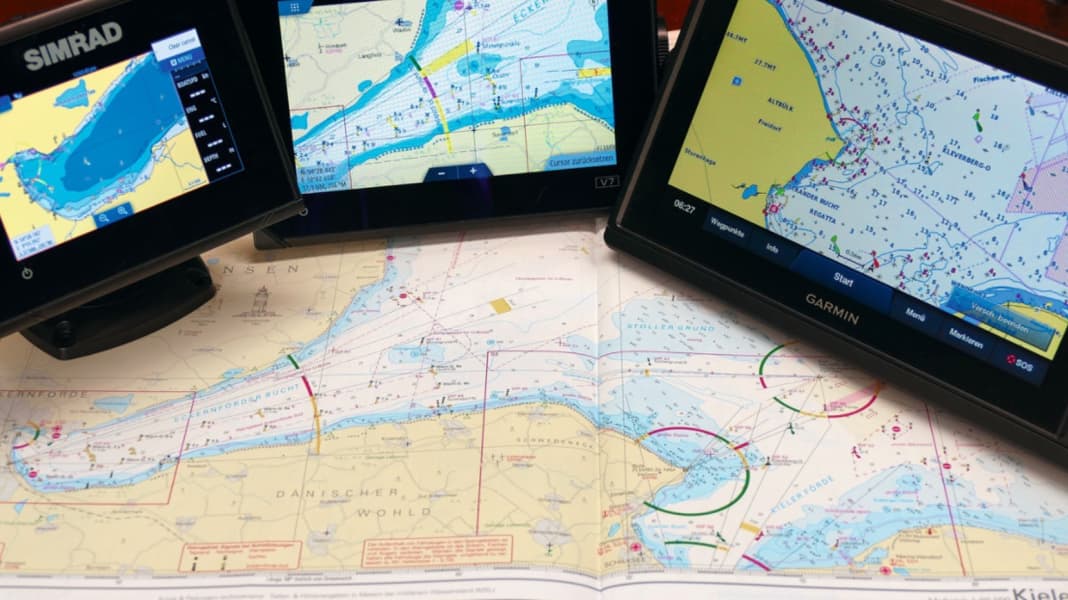
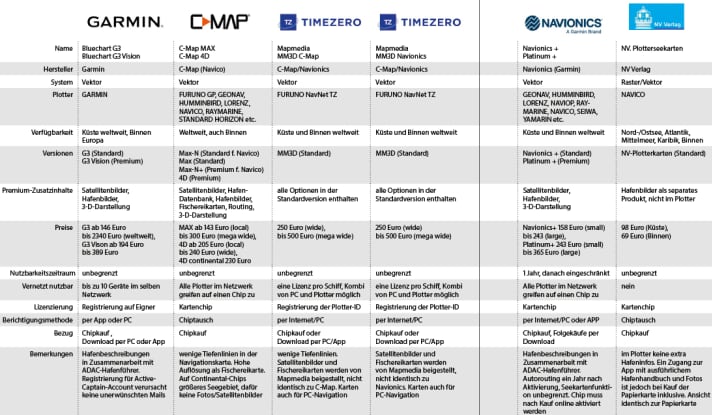
Without a chip with chart data, even the best multifunction display only shows a rough overview, but nothing you can use to navigate. The reason is simple: survey data is expensive, and hardly any customers need charts for the whole of Europe. They are therefore not permanently stored in the device, but each skipper purchases the electronic chart sets for his needs as a separate product for the plotter. Four providers are currently active in this market: Garmin, C-Map, Navionics and Nautische Veröffentlichung (NV-Verlag). Soon - technically speaking - there will only be three. This is because Garmin recently acquired Navionics, and the databases are currently being synchronised. Then there is Mapmedia, Maxsea's mapping company, now known as TimeZero. It processes maps based on Navionics or C-Map, which is why you will find a total of six different map systems in this article.
In addition to the cartography, the individual manufacturers also differ in the data format. This means that not every plotter can read every chip. The classification is only completely clear for two brands: where it says Garmin on it, only Garmin fits in, the TZ-Touch plotters from Furuno only accept Mapmedia data.
With all other plotter manufacturers, this is somewhat more differentiated and often depends on the model. Some even understand several formats. Fortunately, it's quite easy to find out on the suppliers' websites.
Marstal/ÆrØ, Baltic Sea
Challenging fairway with several directional beacons and branching off into the harbour. Position 54° 51.4' north, 10° 31.3' east
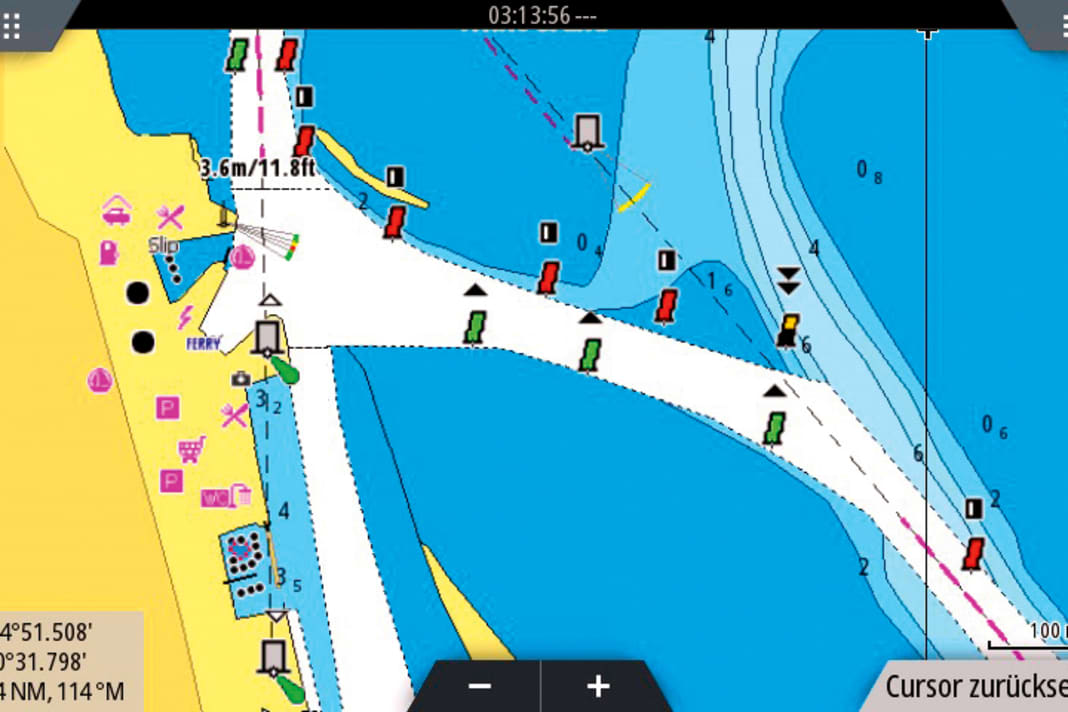


C-Map is reluctant to provide depth information. In1 a value of 3.6 metres is given for the fairway only in the northern branch, the Mapmedia variant5conceals it completely. At best, it is recognisable that it is between 2 and 5 metres. The competitors explicitly state 4.4 metres to the east and 3.6 metres to the north. The exact location of the sector boundaries is only available from Mapmedia5/6 and NV4in the entire relevant area. That C-Map1, Garmin2 and Navionics 3However, the fact that these are only shown in abbreviated form is not due to the map, but to the way they are displayed in the plotter. There is disagreement about the localisation of supply facilities such as petrol stations.
From the map to the data record
Although all the charts are in principle based on the same surveys by the national hydrographic institutes, a great deal of processing and supplementation is still required to turn them into a recreational craft chart. In some cases, re-measurements are even necessary. Which manufacturer provides the "best" work here differs from area to area, even from harbour to harbour. In addition, the same information is presented differently for each manufacturer. It is therefore quite possible that your jetty neighbour prefers a different chart set than you do. A general judgement on how good a provider's charts are cannot be made due to the amount of data. In any case, none of them is error-free.
Wittdün/Amrum, North Sea (Wadden Sea)
Harbour of the Tonnenhof with adjacent mooring facilities for pleasure craft. Position 54° 37.8' north, 8° 23.1' east
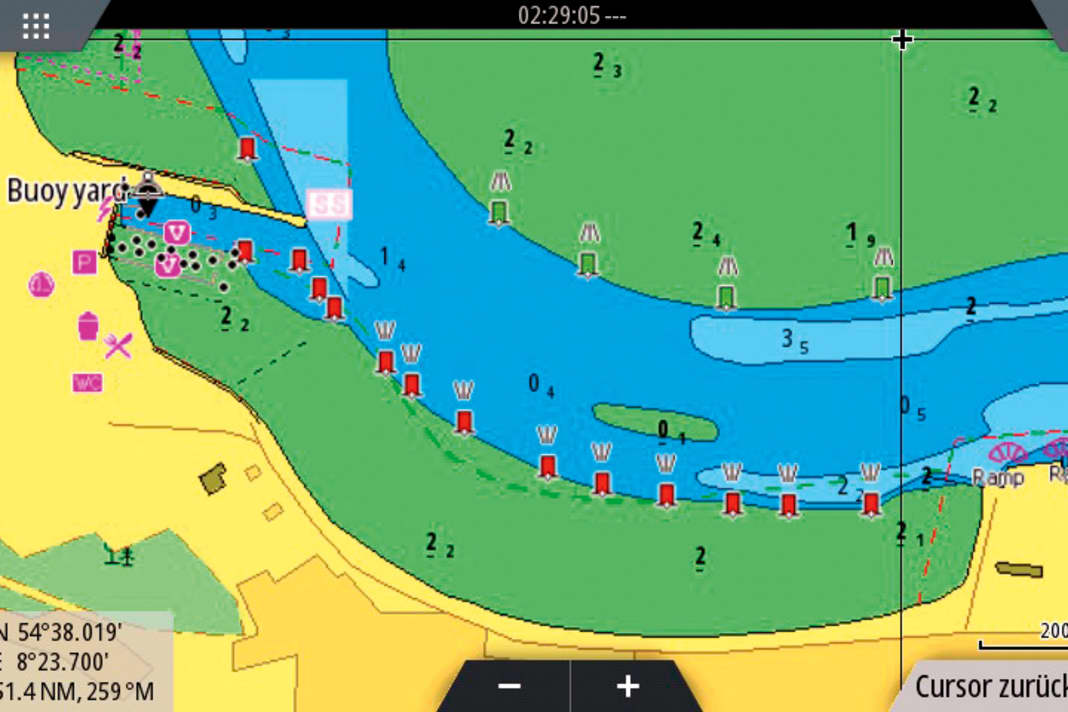


Whether the green buoys are on the northern edge of the tideway or indicate a deeper channel on its southern edge - the information should actually be the same on all six maps.
For the course of the 2-metre line, Navionics3/6 to the west of the ferry terminal has different data to its competitors. C-Map1/5 shows a detailed map of the buoy yard, which does not match the surrounding map north-east of the pier. It was not possible to determine which depth or sea mark version is the newer one, at least not on the plotter. The situation clearly shows that navigation in the Wadden Sea has to be based on current navigational aids, the screen can only provide a rough overview.
Here we show you the differences using exemplary views of three harbours in the North Sea, Baltic Sea and Mediterranean. They may not be in your area. But the three most important providers offer you the opportunity to view your home area in the real charts in advance: On the Navionics and C-Map websites, there is an online view under "Chart Viewer". This works almost worldwide, except when Danish survey data is involved. The charts from Nautische Veröffentlichung can be viewed free of charge in their app as long as they are online. Navigating is not possible with these previews for all manufacturers.
Vector or raster?
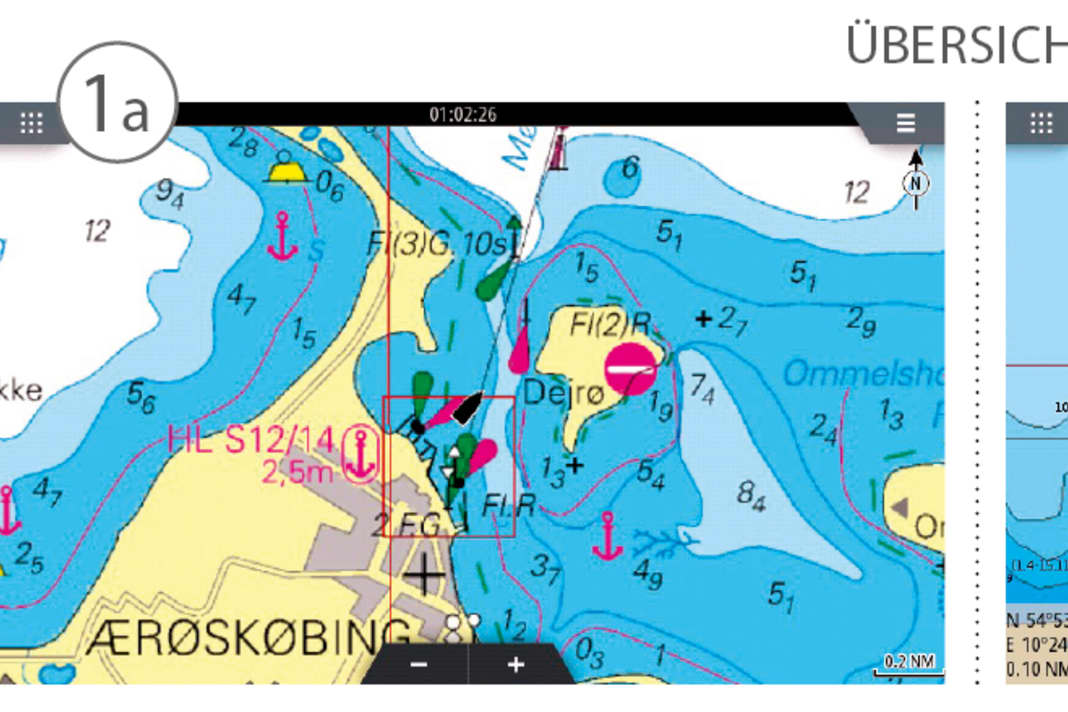


Navionics, Garmin and C-Map supply vector charts, while NV-Verlag produces raster data. This point could previously lead to long discussions about the level of detail on the nautical charts. In the meantime, however, the differences are often barely recognisable. This is partly due to the enormous capacity of today's storage media.
Raster charts are basically images of the printed nautical chart. They can be zoomed in or out to show the desired section of the chart. However, this simple method quickly leads to a problem: when zooming out, details such as navigation marks and depth information are also reduced in size; when zooming in, these details also grow. Today, storage space is no longer a problem, so current raster maps consist of a large number of images. This means that a suitable display can be called up for each zoom level and coarse resolution is no longer an issue.
Vector charts do not store a finished view, but only the course of depth contours, positions of sea marks and depth data. The chip therefore contains lists of points. For example: Depth contour 2 metres from point A to B to C and so on. An image is only created from this at the moment this line is drawn on the screen by the plotter.
The method requires much less storage space than raster data, as one data set is sufficient for almost all zoom levels. Additional information can also be easily integrated. The navigation marks and fonts always remain the same size at all zoom levels.
In practice, however, the latter is not such a great advantage: there is no direct indication of the size of the currently displayed area, as the human eye is used to from paper maps. To compensate for this, all plotters display either a scale or the current zoom level in the image.
When zooming out, the vector map has the opposite problem to the raster map: as sea marks and depth information remain the same size, the screen becomes increasingly full and soon the map would no longer be recognisable beneath the marks. It is true that the cartographer can specify the zoom level at which each item of information should be hidden. However, this is time-consuming and is often left to an automatic system. As a result, symbols sometimes do not show what they are supposed to at all zoom levels.
In raster maps, the cartographer has a practically free hand in the design. For example, if a sea mark symbol would obscure other important information, he can simply rotate it slightly. You often see this on small fairways. Even more common, but hardly noticeable: the light drop on lights is rotated so that it does not cover the water to be lit.
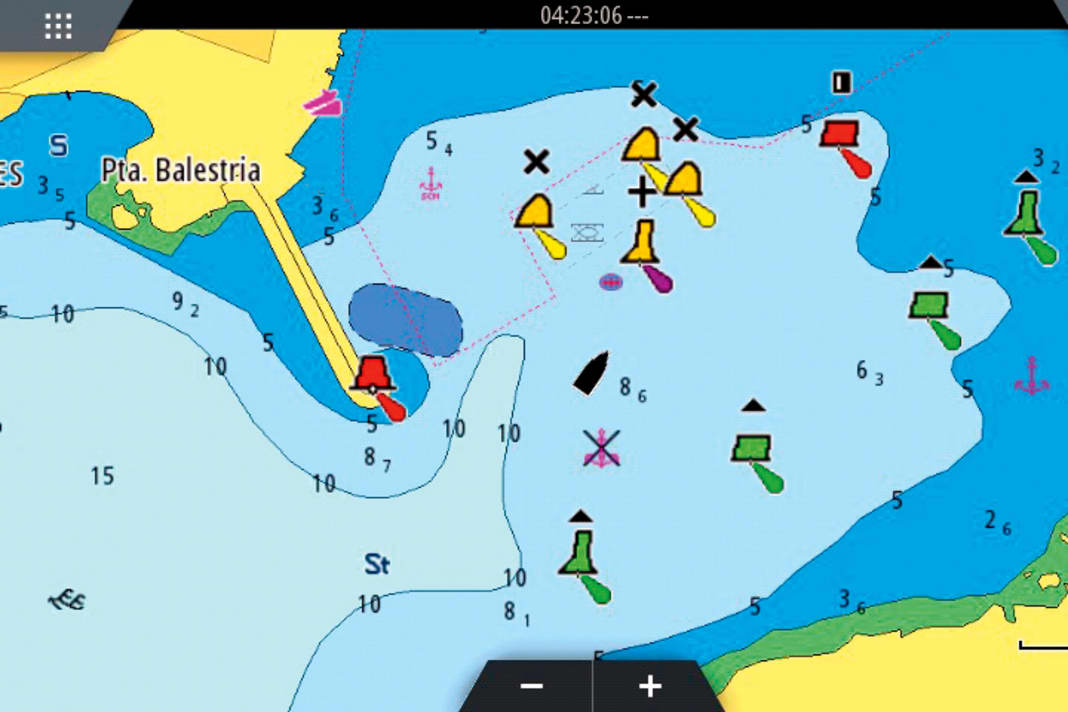
Port D'Andratx/Mallorca, Mediterranean Sea
Harbour and buoy field near the southwest corner of Mallorca. Position 39° 32.6' North, 2° 23.0' Eastt


There is agreement on the buoyage only with regard to the four green buoys on the south side of the fairway. C-Map, Garmin/Navionics and NV-Verlag each have their own versions for the fish farm to the north.
The depth profiles, which appear very different at first glance, are only due to different threshold values for the colouring. If you look at the pure depth lines, the contours are similar. 1/5 The two C-Map charts are very cautious with the depth contours. The passage between the pier heads, which is actually almost five metres deep, is not visible on these charts, and this does not change when you zoom in further.5/6 The depths in these two screenshots are in feet, not metres. The depths therefore correspond to the other maps.
With vector maps, on the other hand, the cartographer can only use ready-made characters from a predefined library. He does not draw these himself as required, but creates the entry "Character X at position Y". Optimisations for better legibility are only possible to a very limited extent.
For navigation on a motor yacht today, it is irrelevant whether the chart is based on raster or vector data. Some skippers even find the raster view more pleasant, as it offers the same impression as the paper chart. The situation is somewhat different with high-resolution depth data for fishing: These are currently not available in raster charts.
Normal or Premium?
Navionics, Garmin and C-Map each offer two different equipment lines in addition to different covers. This is of course reflected in the price. The standard equipment includes all the data you need for navigation with all three and, of course, also with the competitors. The luxury version also includes comprehensive satellite images and the option to display the chart in 3D.
If your plotter has been on board for a long time, check whether your little treasure can display the additional data at all before investing in the upmarket equipment. The device's capabilities can possibly be upgraded with a software update, but the computing power can become a bottleneck. Sometimes this can even make the response to normal navigation sluggish. And nothing is more annoying than devices that react slowly to inputs.
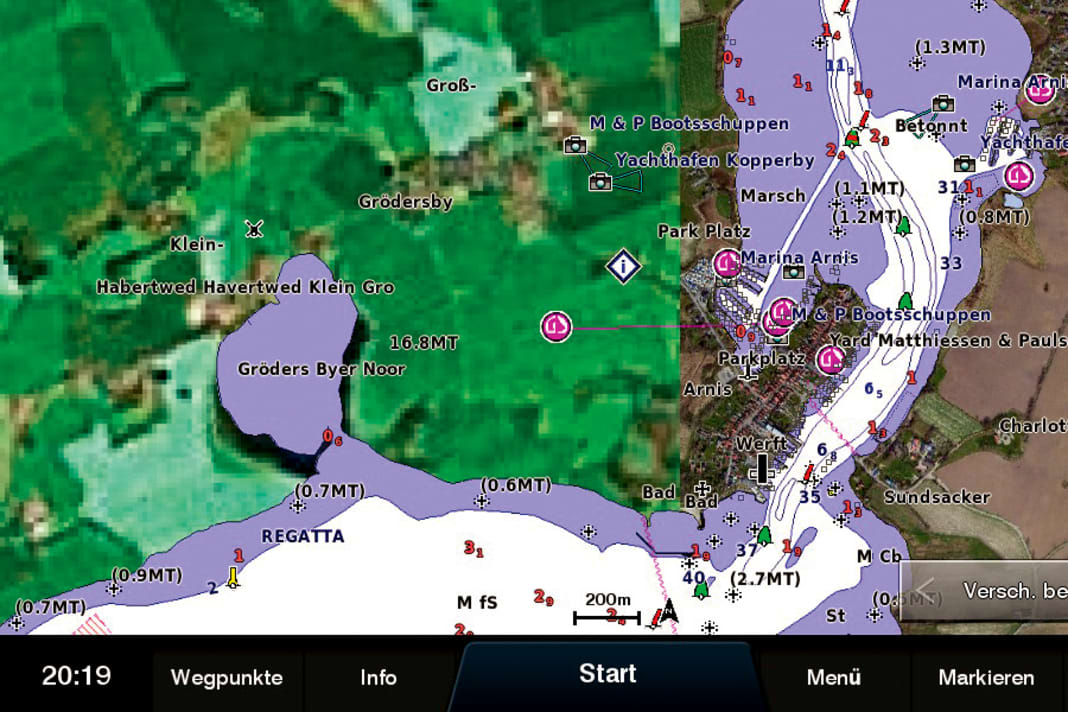
You should not expect the satellite images on the map chip to have the resolution of Google Earth or Bing; no provider can accommodate this amount of data. The screenshots on page 61 give an impression of the rather coarse image data.
Trust? Control is better
Sometimes maps even contradict themselves:


Ways to the map
Buying a chip with the data from the ship chandler is no longer the only way. Garmin, Navionics and Mapmedia offer the alternative of purchasing the data sets online. Downloading is only one of the necessary steps, as all manufacturers use copy protection. This is understandable, as surveying is time-consuming and the data is therefore expensive.
With Garmin, you first create an account with the manufacturer's Active Captain service to purchase online. This is free of charge, your personal details remain with Garmin and there are no unsolicited mails. You can then use this identity to purchase the map sets, which can be used with all Garmin devices registered to the same Active Captain account. As the maps cover quite large areas, a complete download would be too time-consuming. Garmin has therefore divided the data sets into map squares, so you can freely choose which are needed immediately and which are needed later or not at all. Additional squares can be downloaded at a later date without any problems.
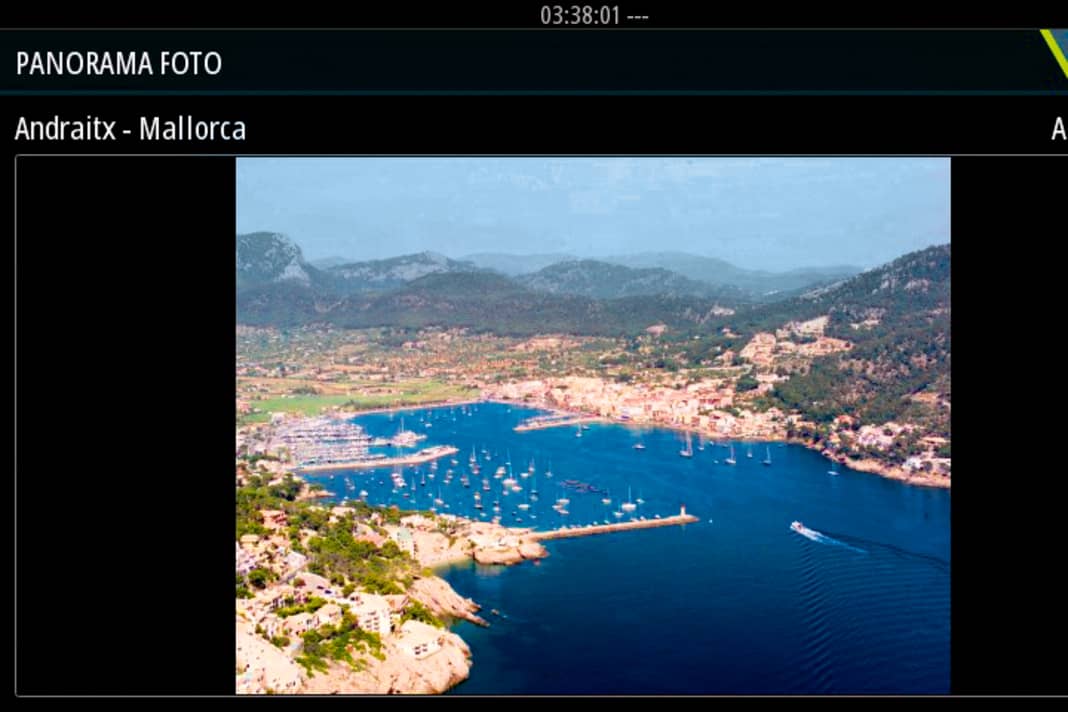
Harbour pictures & manual
Additional information beyond the cartography: Helpful, but no competition to the printed work


Before the first download, some typing is required for registration, subsequent purchases are then very quick. The big advantage, however, is that you don't have to buy a special chip from Garmin. The maps can be purchased and obtained practically anywhere where there is Internet access.
No registration is necessary with Navionics, but the data purchased online can only be loaded onto a memory card prepared by Navionics. It is not possible to make an initial online purchase. However, the chip does not have to leave your boat to install corrections and for the recommended annual update.
Like Garmin, Mapmedia offers a complete online purchase. The licence is linked to the system ID of your boat. This is an automatically generated identifier that applies to all networked Navnet plotters on board. At the same time, you can use the charts with an installation of the TimeZero software. You also need this system ID to purchase pre-recorded Mapmedia chips from the dealer.
Photo overlay
Images on the chip are no substitute for Google Earth, but better than nothing


For C-Map customers, a single letter has great significance: chips labelled Max-N or Max-N+ only run in plotters from B&G or Simrad. "N" really stands for the device manufacturer Navico.
The same charts, but for Raymarine and others, are called Max and 4D respectively. The data for Navico devices is saved in a different format. The chip from your neighbour's Raymarine plotter will therefore not run in your Simrad navigator.
Electronic charts for the plotter become outdated just as quickly as paper charts. They therefore also need to be corrected, but this is called an update and is sometimes done online. Manufacturers generally only charge half the price of a new map when purchasing a new one or when updating after one year. Garmin, Mapmedia and Navionics also offer free updates via download within the first year.
Who is the best?
The cheapest way to navigate is with the maps from NV-Verlag. Although no additional information is stored here, this is already on board if you also use the manufacturer's paper charts. Unfortunately, they currently only run on devices from B&G, Simrad and Lowrance. Originally, Raymarine also supported this format and distributed it itself via download. However, the manufacturer is currently completely reorganising this business area, which is why it is currently not available. However, NV charts will be available again in the future.
Navionics and Garmin already offer identical data in large areas, and the differences should disappear completely in the future. So if you prefer this type of map, you have quite a large selection of plotters to choose from.
The standard display of the C-Map charts sometimes shows very few depth contours. However, the information is contained on the chip, you just have to switch it on explicitly. The item in the plotter menu is called "High-res-bathy".
